(The Hungarian version of this blog post is available at the following link. Additionally, an extended Hungarian version of this post can be accessed at the Hungarian Academy of Sciences, Centre for Social Sciences, Institute for Minority Studies journal: 'Regio'.)
Perhaps the most renowned ethnic map, the "Carte Rouge" was one of the most referenced Hungarian cartographic documents of the Paris Peace Conference. First published 100 years ago, this map came to fruition on the 21st of February in 1919. Hungary, as part of the Austro-Hungarian Monarchy lost the First World War in the latter part of 1918. From October of 1918 onwards, Hungarian representatives from various scientific disciplines expeditiously tried to organize the scientific background of the Hungarian territorial argumentations for the peace-negotiations. This period was one of the most intensive times of joint collaboration between the realms of science and politics. Pál Teleki (1879-1941), who was the contemporary chief secretary of the Hungarian Geographical Society led this uprise, along with other Hungarian geographers. Teleki edited various materials himself, which he began when he was recovering from the Spanish flu. From these, his best known work to date is the „Carte Rouge”, the „Ethnographical map of Hungary based on the density of population”, which he edited with the help of Ferenc Nopcsa (1877-1933). The reputation of the map was principally based on its career as per the peace-negotiations. Moreover, this map was the only map which the leading politicians of the entente-powers most definitely looked at. At the request of Lloyd George (1863-1945), British prime minister, Albert Apponyi (1846-1933), leader of the Hungarian delegation, showed a copy of the map to the members of the Supreme Council of the Paris Peace Conference following his speech.
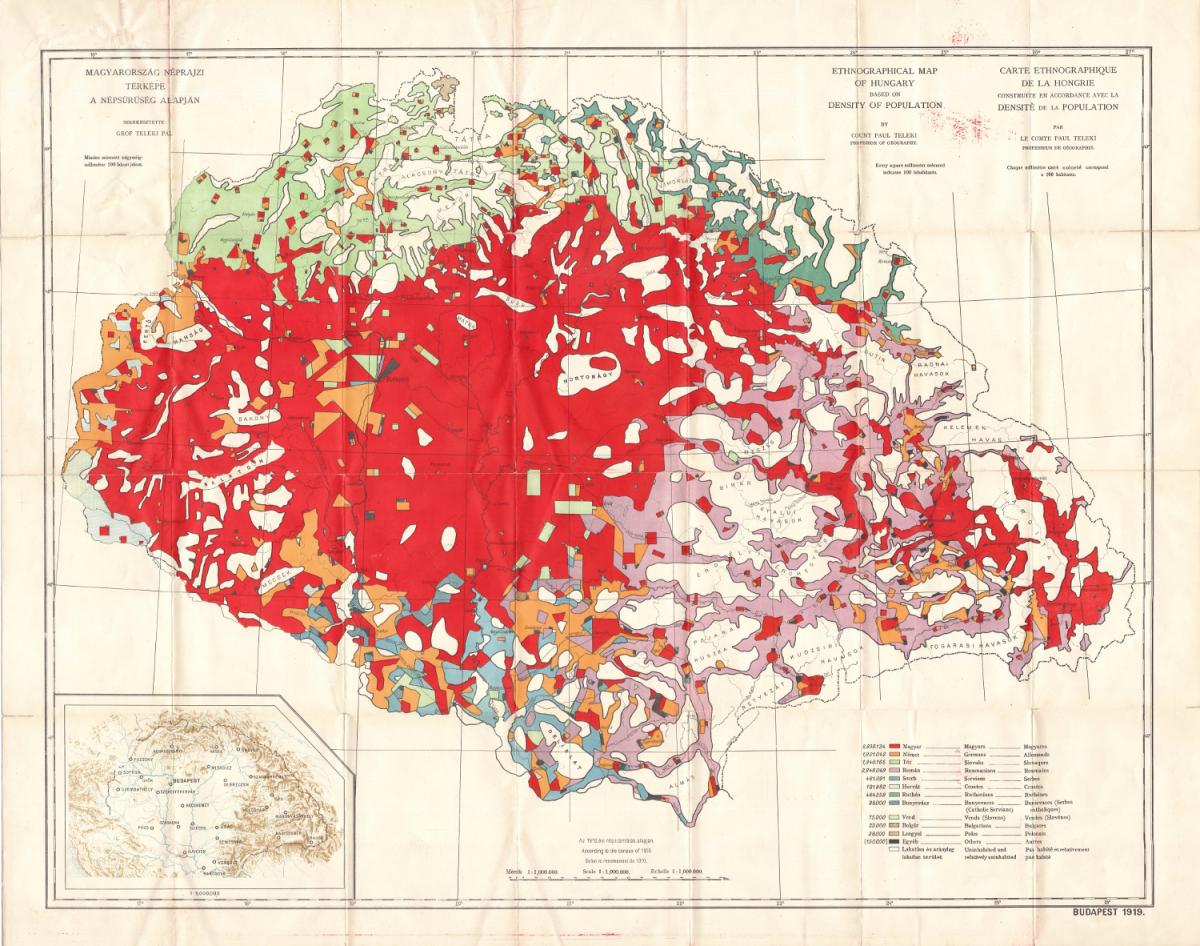
Fig.1. Paul Teleki: The ethnographical map of Hungary based on the density of population, 1919. (first edition)
from the author's private collection
This map was not only crafted as neccasary scientific background material for the peace-negotiations, it was also made available to the public; meaning one could buy it in various book stores and at newspaper publishing companies. A local newspaper called the „8 Órai Újság” [News at 8 o’clock] printed the first edition of this map on the 21st of February in 1919. Though the manuscript edition was, as we will see below, likely known earlier, we can use this date as the date of birth of the Carte Rouge.
 Fig.2. Report on the publication of the Carte Rouge in the "8 Órai Újság" (source)
The editing of the map began in Autumn of 1918. On the map, the 1mm by 1mm colored areas depict clusters of 100 inhabitants. Theoretically, the map was accurate, however the various ethnic groups were, at times, represented at a significant geographical distance from their actual geographical locations.
The map was ready in January of 1919, after a mere six weeks of work on the map. Subsequent to the end of the First World War, Hungarian geographers intensively prepared for the peace-negotations. The first step they took was to edit the Ethnographical map of Hungary on a scale of 1:200,000. The editing of this map was suggested by Teleki. However, the editors of the map itself were Zsigmond Bátky, an ethnographer/geographer and Károly Kogutowicz, a cartographer/geographer. This manuscript-map used the dot-method as its primary mode of representation. Containing 45 large sheets, this map was based on the General Map of Central Europe. Oftentimes, this map is incorrectly assigned to the Carte Rouge, most especially within the relevant cartographical and historical academic literature. At times, it is defined as the larger, earlier version of the Carte Rouge. Both of these notions are false as the two maps are not similar. At best, the Bátky-Kogutowicz map is a historical antecedent of the Carte Rouge.
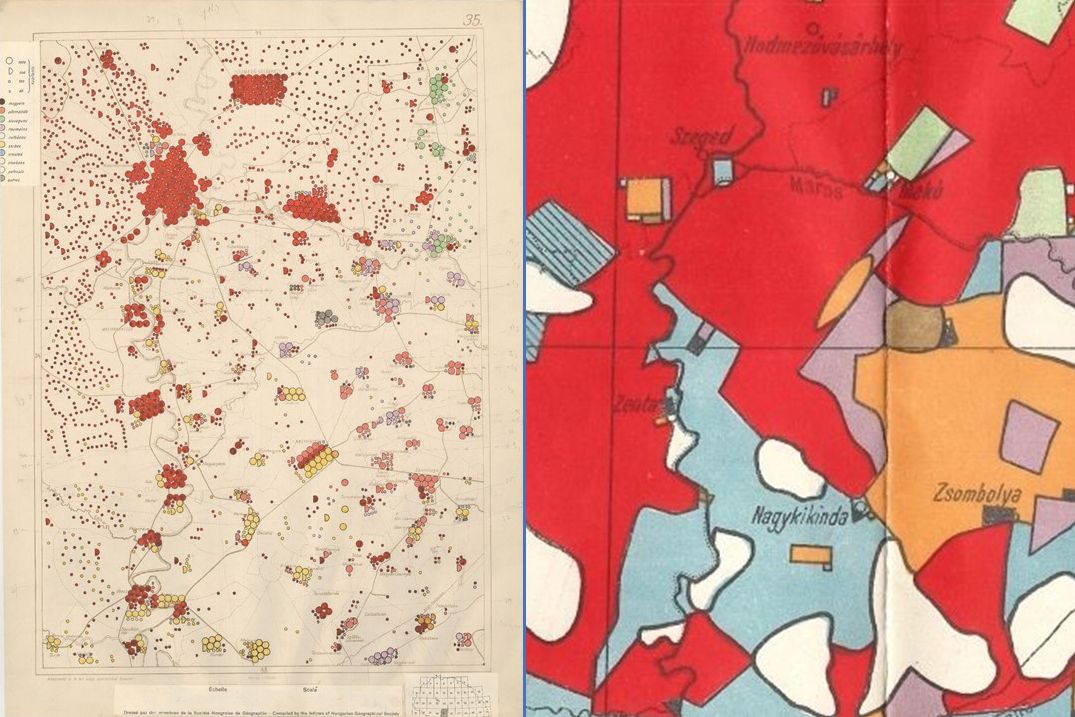
Fig.3. The Bátky-Kogutowicz map (left) and the Carte Rouge (right)
from the author's private collection
The reputation of the map was principally based on its career as per the peace-negotiations. Moreover, this map was the only map which the leading politicians of the entente-powers most definitely looked at. At the request of Lloyd George, British prime minister, Albert Apponyi, leader of the Hungarian delegation, showed a copy of the map to the members of the Supreme Council of the Paris Peace Conference following his speech on 16th January 1920.
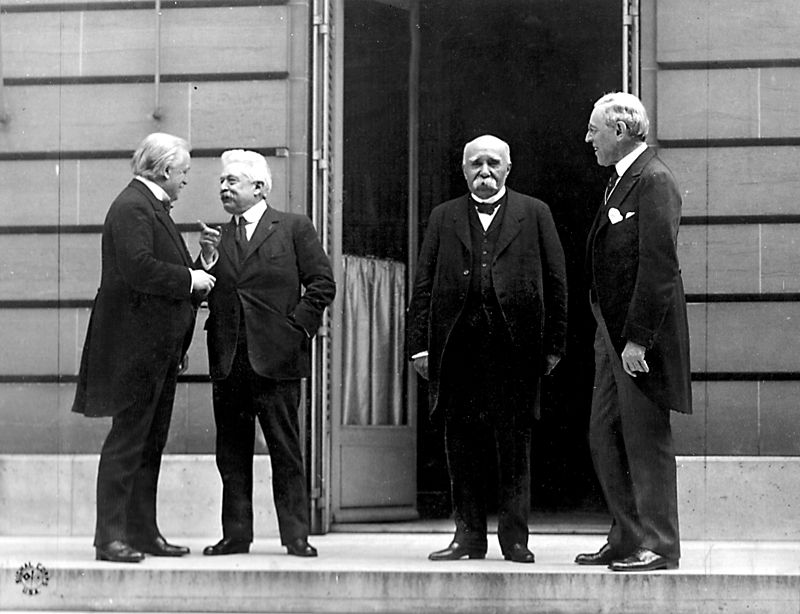
Fig.4. The leading politicians of the entente powers (source)
Teleki edited this map with the help of Ferenc Nopcsa in late 1918. Nopcsa did the calculations, while Teleki drew the map. Teleki was not fully statisfied with the representation method of the more detailed Bátky-Kogutowicz map. He was of the mind that the map was not clear enough in its rendering as it was apparently too large. He was also critical of the small dots on the map and that it consisted of too many sheets. Based on similar grounds, the Carte Rouge was planned and executed in a smaller format, on a scale of 1:1,000,000. The main goal of the map-makers was the fast and complex transmission of information on territorial claims to the decision-makers. The representing-method of this map was very different from that of other ethnic maps.This map utilized the value-by-area cartogram method. The population density on this map was not represented, the method went on the representation of the absolute population data. Red colour was used on the map in order to represent the Hungarians on the map; hence the well-known name „Carte Rouge”. This solution was a typical example of the subjective colouring of contemporary ethnic maps. With the help of the red color, the map-maker visually depicted the apparent dominance of Hungarians in the Carpathian basin. This method was typical in that region during that time period.
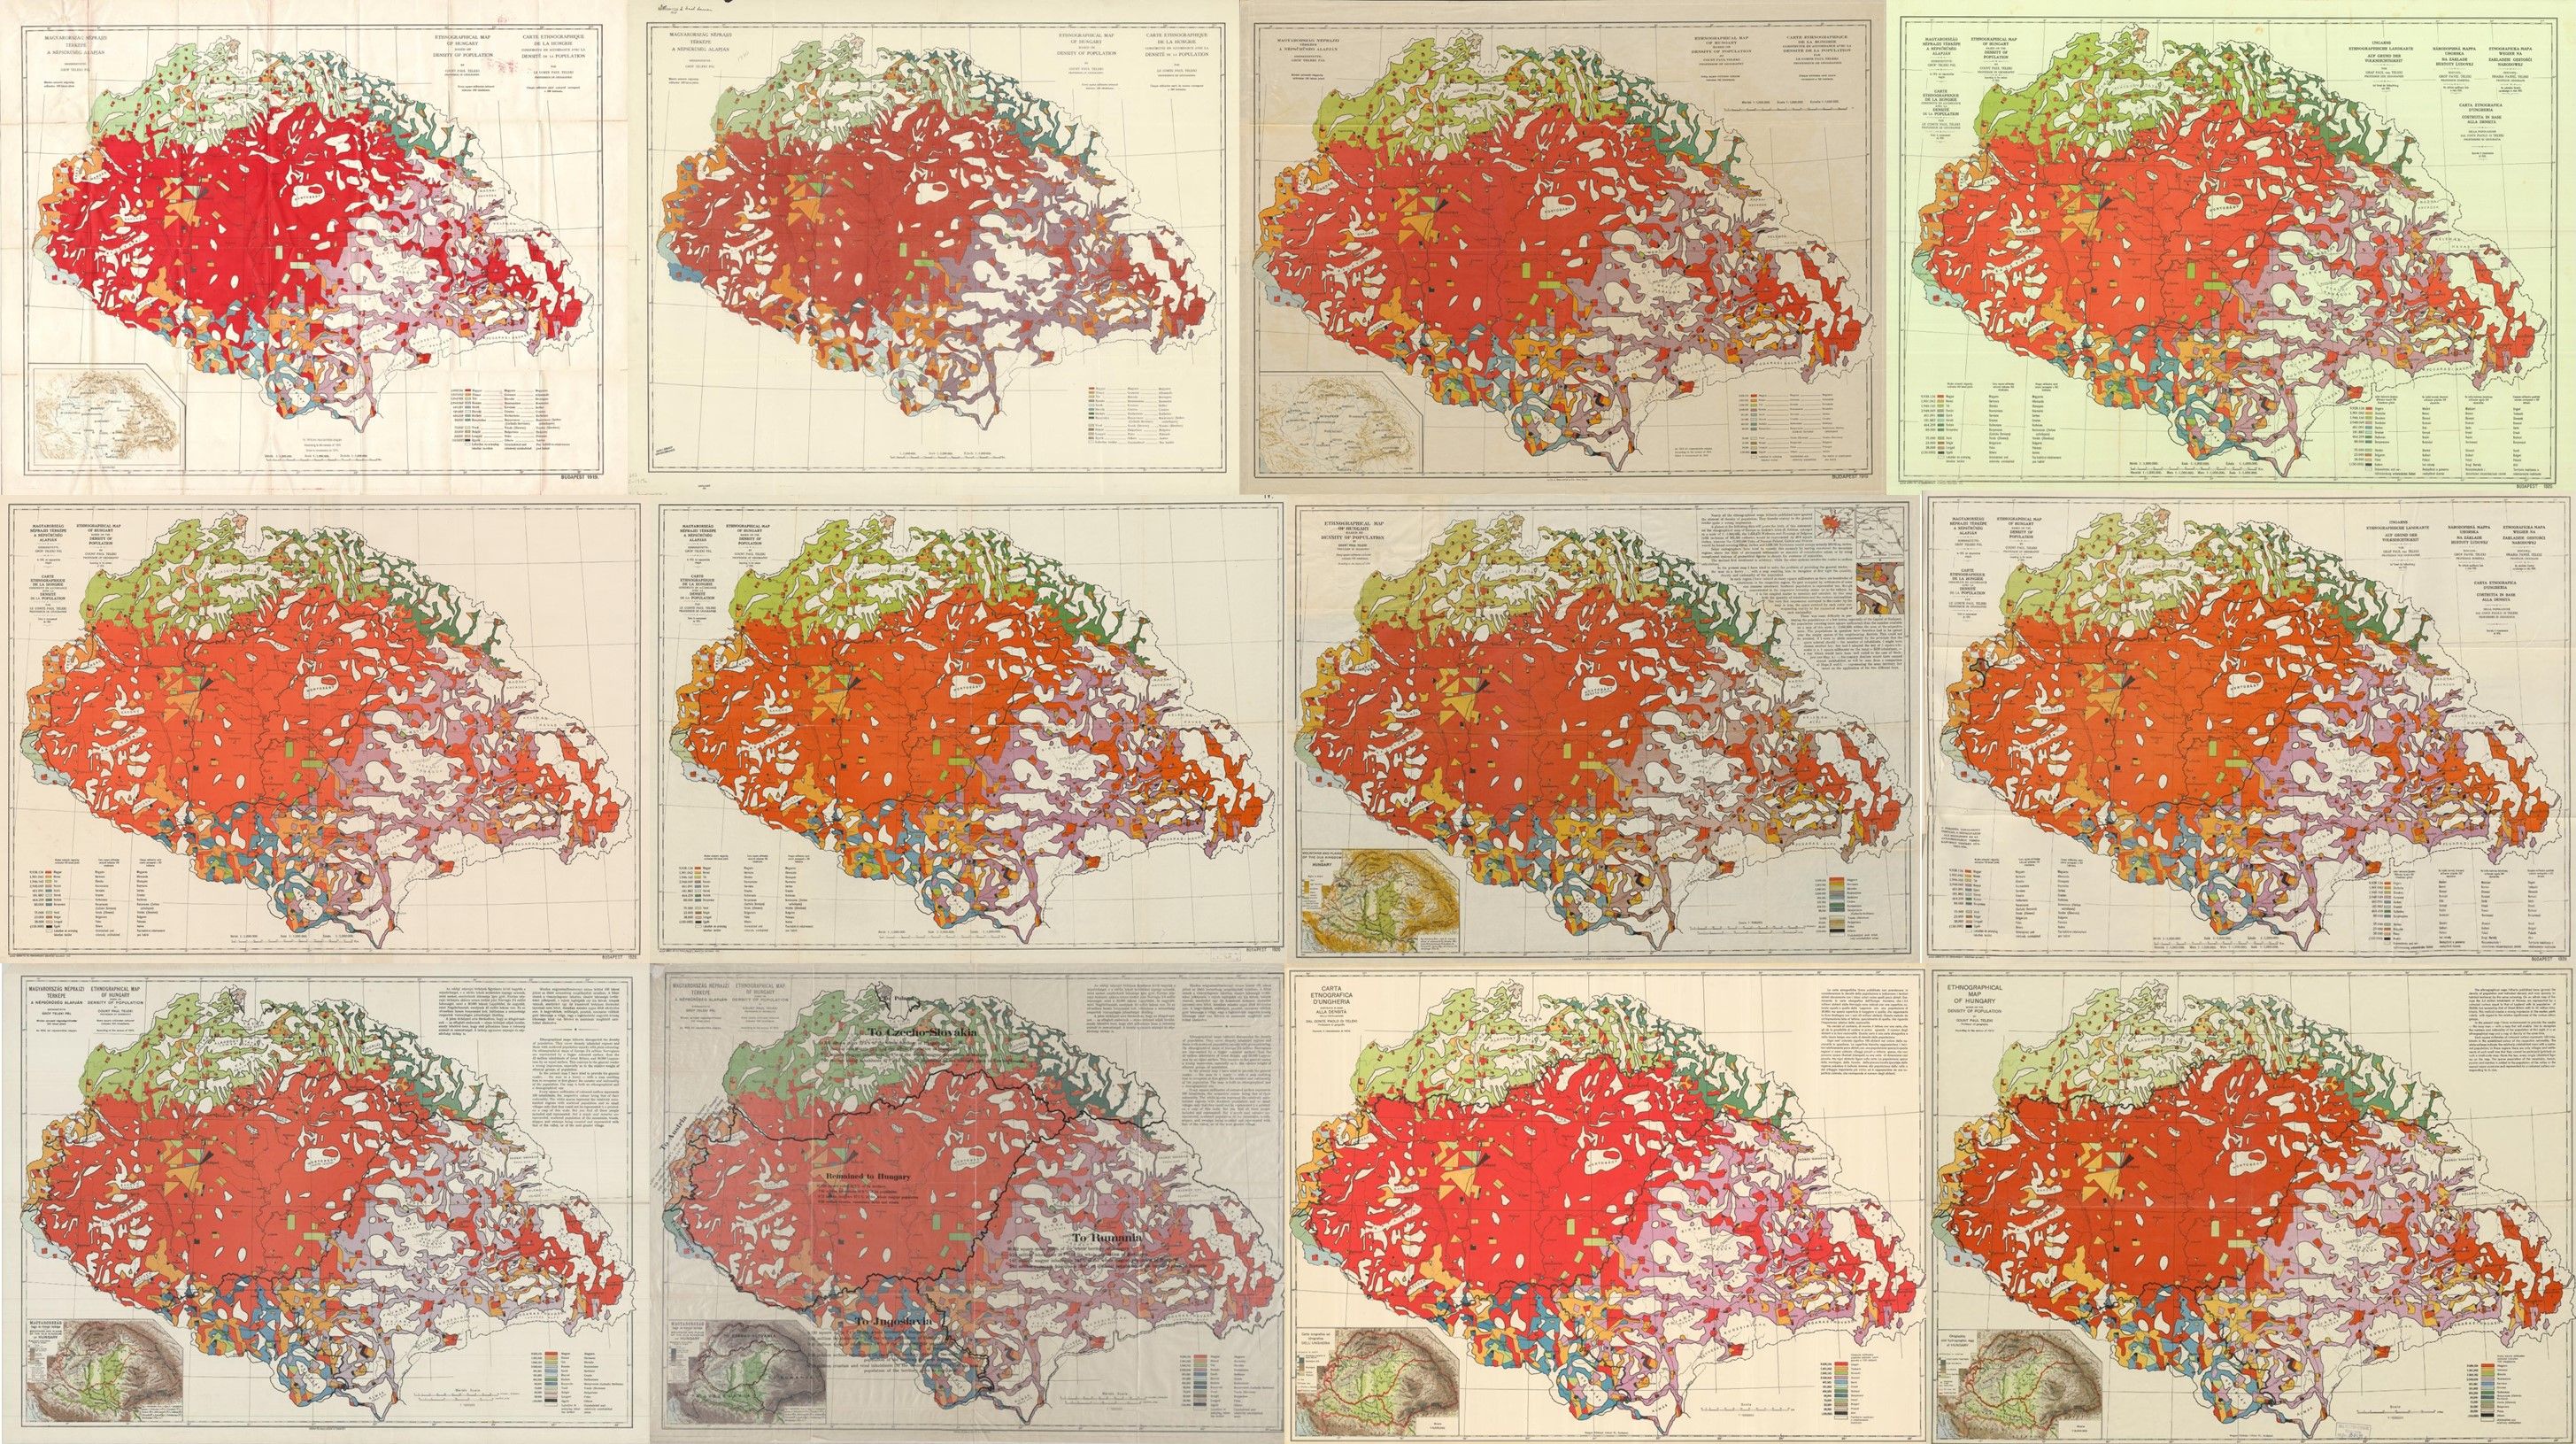
Fig.5: A few versions of the Carte Rouge.
Source: private collections
Between 1919 and 1941, 12 various printed editions and 27 versions of the Carte Rouge have been accounted for. I collected these separate versions and have presented them below in a well-illustrated cartobibliographical list, which one can access at the map-historical blog of the Map Collection of the Széchenyi National Library (here, here, here and here). These versions are at times independent editions, or attachments from various books or atlases. The size of the sheet and the thematic content of the map was the same, but the state borders, the position, language and/or the content of the texts were oftentimes quite different.
During the Paris Peace Conference, political actors involved attempted to demonstrate their respective territorial claims with the help of allegedly scientifically based argumentations. The ethnic argumentation gained merit with time. This came partially from Wilson’s Fourteen Points. Based on this manifesto, the peoples and the politicians in the fallen countries hoped, that the future state borders will follow the ethnic borders.
In general, geography played an important role during the peace-negotiations. The Brits (Naval Intelligence Division Geographical Section), the Americans (Inquiry) and the Hungarians (Békeelőkészítő Iroda) had separate scientific background institutions, based on methods of contemporary geography. Geographers from other countries, such as Emmauel de Martonne from France, Albrecht Penck from Germany, Jovan Cvijić from Serbia, the Romanian Vasile Merutiu and the Polish Eugeniusz Romer played integral roles in evaluating or presenting geographical works at or for the peace-negotations.
The Hungarian geographical background-materials had a special duality. On the one hand, they tried to refer to the right to self-determination, which was defined in Wilson’s Fourteen Points. On the other hand, they tried to refer to the theories of French human geography, which became dominant under the lead of Vidal de la Blache (1845–1918) and Emmanuel de Martonne, who played important roles during the peace negotiations. Based on this theory, the geographical region came from the symbiosis of natural geographical and human geographical attributions. Besides the 'raw' statistical ethnic composition of the map, the spatial usage of various ethnic groups was also considered. The Carte Rouge by Teleki is a good precedent for this duality. Within the context of the ethnic argumentation this was the most important goal of the map-maker in representing the exact population of the various ethnic groups. Nevertheless, the map-maker had liberty in designating the location of the various groups on the map. This presented map-makers with a chance for cartographic manipulation as they could represent the various ethnic groups with different details. For example, Hungarians in Transylvania predominately lived in towns in 1910. Most Romanians lived in villages, or in sheepfolds in the mountains. The borders and the geographical extensions of the represented inhabitant areas were thus, imperative to consider.
The Carte Rouge can be found in the relevant international academic literature. There are several articles, reviews, and short references about this map in an array of sources.
United States:
Wolfgang Louis Gottfried Joerg (1885-1952), was a member of the American Geographical Society from 1911 onwards. He played an important role in the formation of the research profil of the society under the direction of Isaiah Bowman (1878-1950) at this Society. He referred to the method of the map as „ingenious" in his article:
”(…) a general ethnographic map of Hungary on which, by an ingenious method, the area shown as inhabited by each nationality is proportional to its numbers; (…)” Joerg, Wolfgang Louis Gottfried: Recent geographical work in Europe. Geographical Review, 1922/3. 479.)
This sentence reveals a rather difficult story: Pál Teleki (and Jenő Cholnoky) had very good American geographical references. This was the result of an excursion to America in 1912. The American Geographical Society celebrated the 60th annivesary of its existence as well as the opening of their new building in New York. Many geographers from all over the world were invited to their opening. Following the celebrations, they made a two-month-excursion by train between the east and west coasts of America. This Transamerican excursion was one of the most important events of contemporary geography. 34 European and 90 American geographers participated in this event. The names of Joerg, and Emmanuel de Martonne can be found in the list of participants.
Isaiah Bowman, the president of the American Geographical Society and the head of the American peace preparation institute, the Inquiry, had a private copy of the Carte Rouge. This copy was sent to his hotel in Paris. Bowman lived in this hotel in the first half of 1919. Perhaps this copy is the oldest known version of the Carte Rouge.
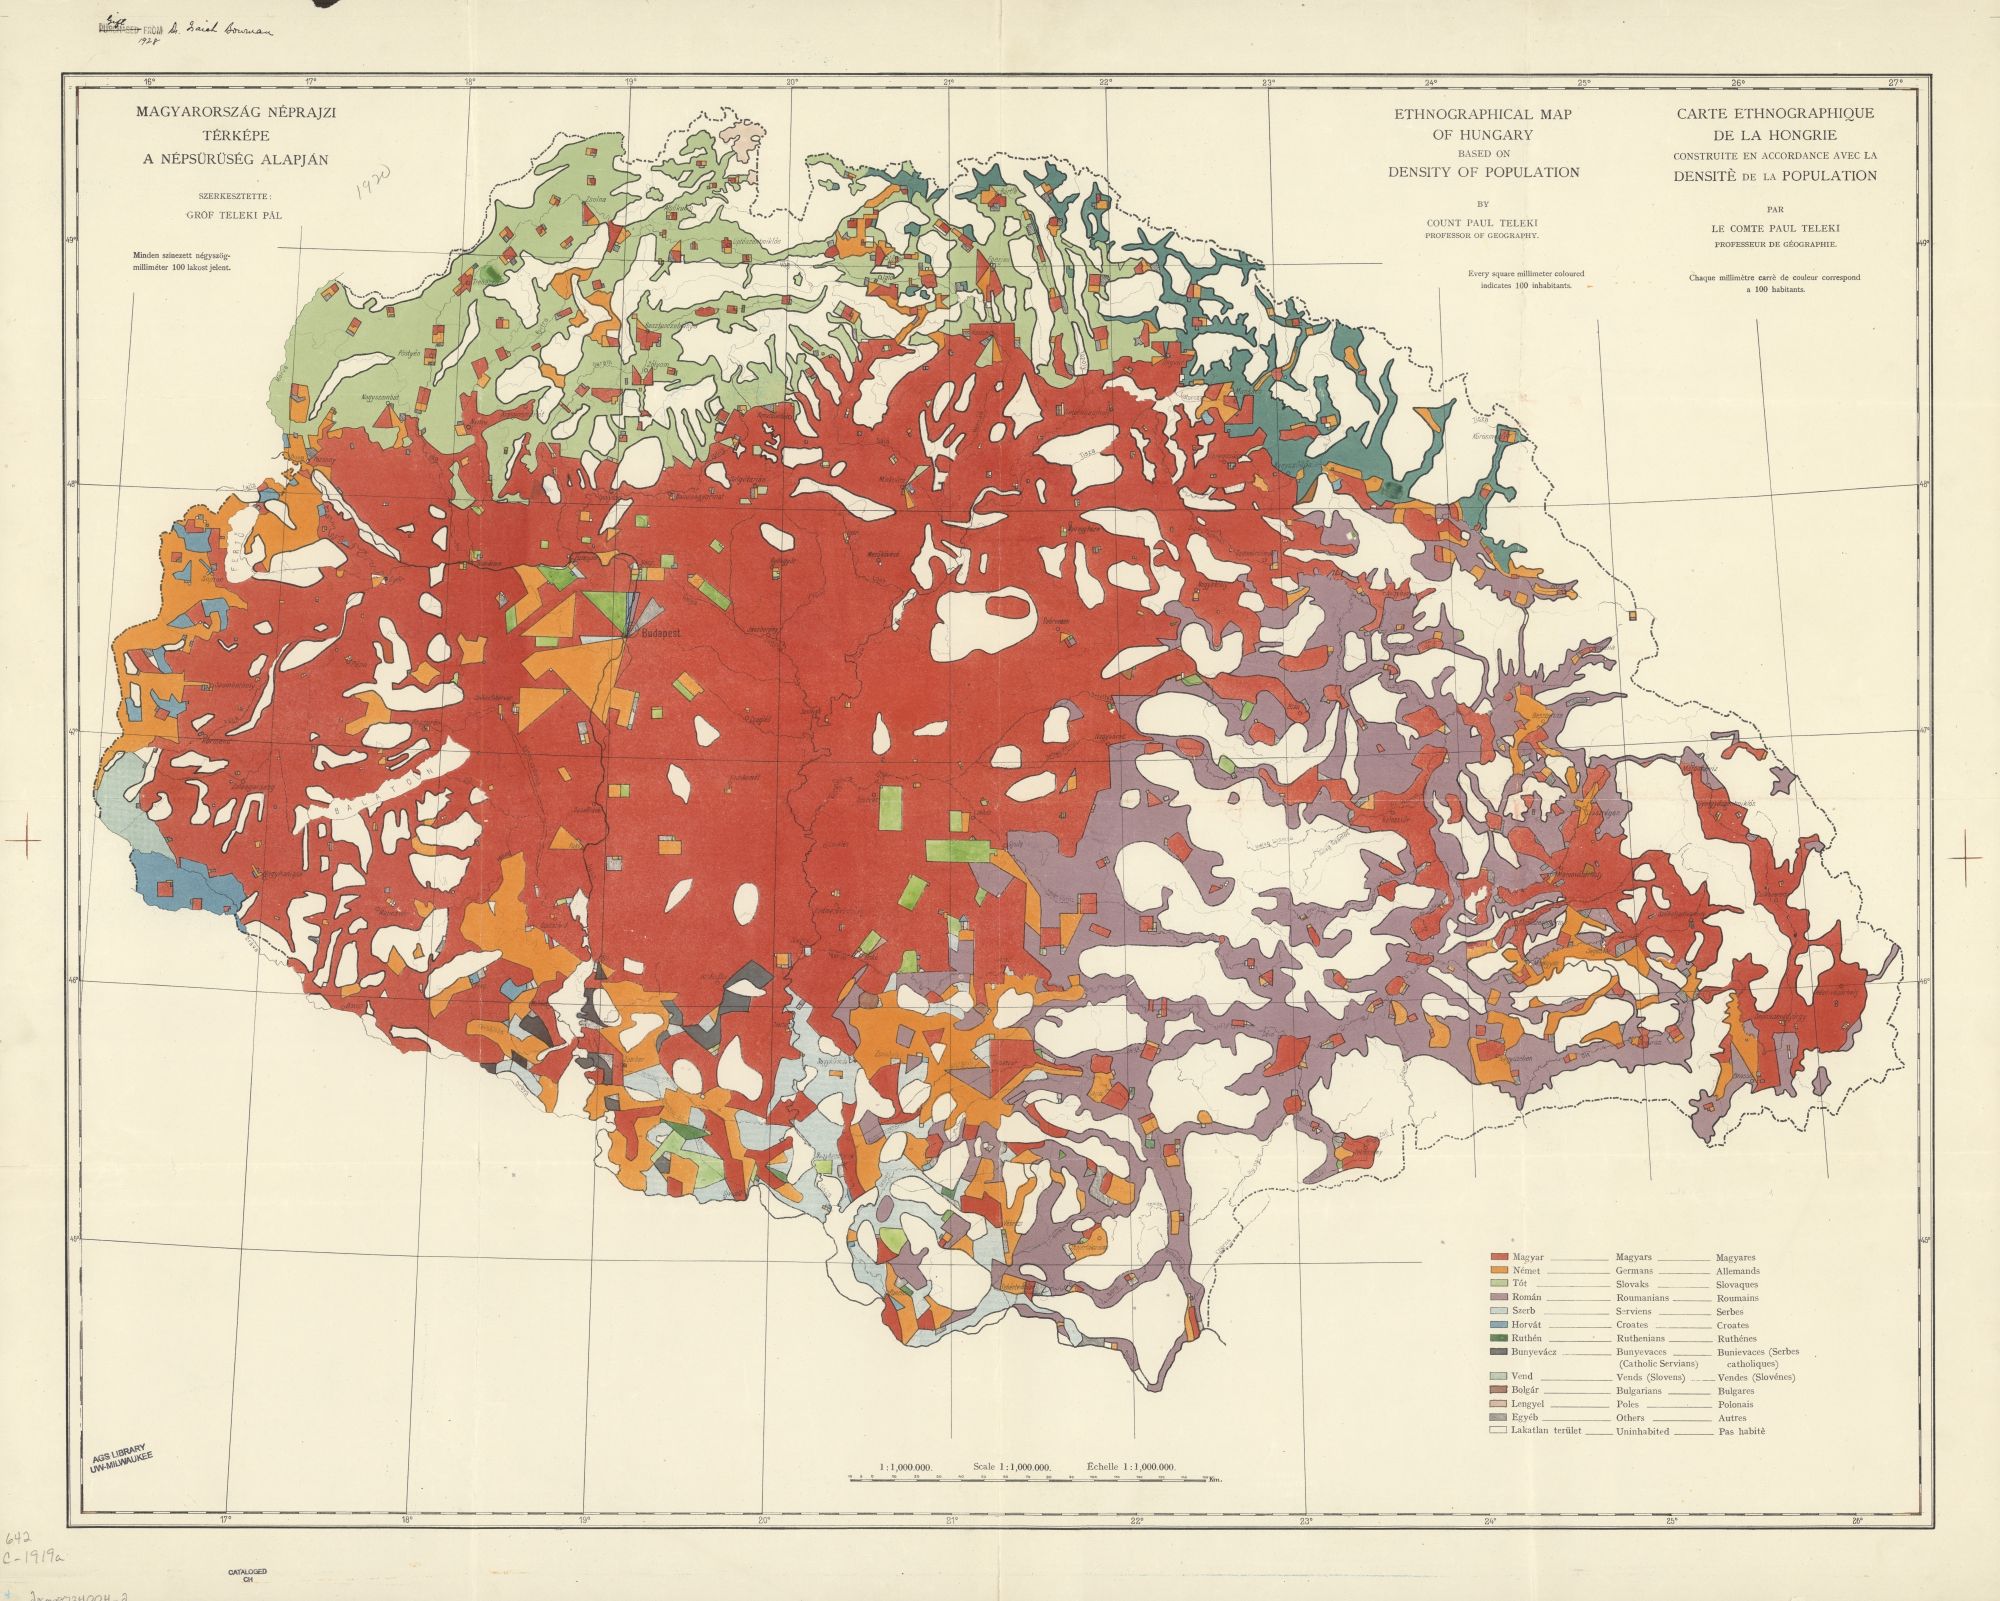
Fig.6. The Carte Rouge manuscript from Bowman's personal collection
Source: UWM-American Geographical Society Library, 642 C-1919a (Milwaukee)
Bowman’s answer to Teleki was not found in this relation. However, Bowman's critical thoughts about a map from Teleki in his brief to W. L. G. Joerg on 4th March 1919 are of note:
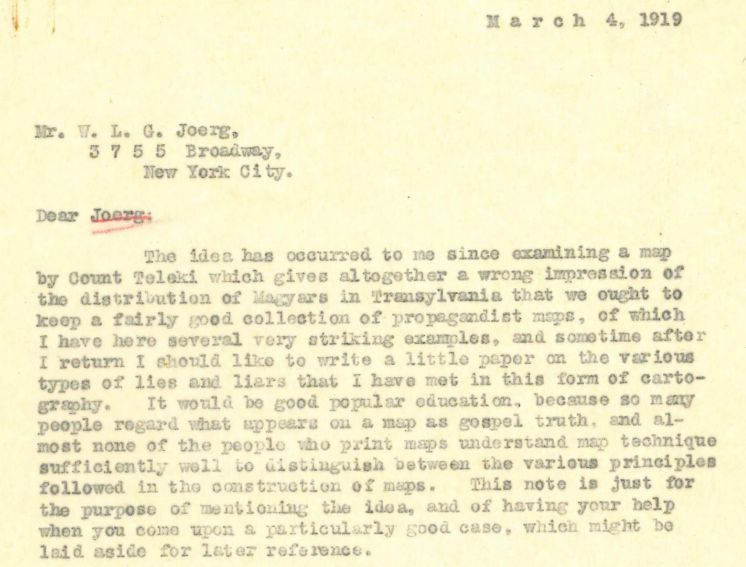
Fig.7. Bowman's letter to Joerg on the 4th of March in 1919
Source: UWM-American Geographical Society Library: Isaiah Bowman's letter to W. L. G. Joerg on 4th March 1919. Correspondence between Isaiah Bowman and W.L.G. Joerg. AGSNY AC 1, 185. box, 38. folder, 7. letter (Milwaukee)
Altough Bowman did not clearly reference the Carte Rouge, it is very likely, that he had the Carte Rouge in mind because until March of 1919 no other ethnic map was published under the name of Teleki. This personal letter displays that Teleki (and by extension, Hungary) did not have a proper chance to convince the American actors during their activity at the Paris Peace Conference about the Hungarian argumentations. The prior personal relations between Bowman and Teleki did not effect the decisions made at the Paris Peace Conference. Teleki tried to contact Bowman at the end of 1918, based on the aforementioned Transamerican excursion in 1912; however, he was evidently unsuccessfully.
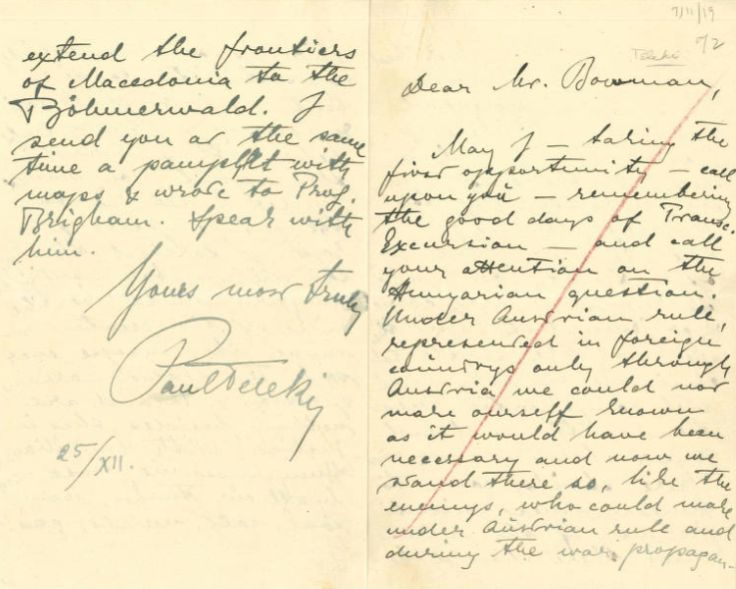

Fig.8. Teleki's letter to Isaiah Bowman on the 25th of December in 1918
Source: UWM-American Geographical Society Library: Teleki's letter to Bowman on 25th December 1918 Correspondence between Isaiah Bowman and Count Paul Teleki. AGSL-Ny Archives, 189. box, 9. folder, 1. letter. (Milwaukee)
Later, when politics no longer influenced the personal and scientific spheres to the degree it had at an earlier, more tumultuous date, Teleki and Bowman came to be good reference points for one another. So much so, that in 1922, Teleki held an American lecture tour. A modified version of the Carte Rouge, along with other documents were published with the help of Bowman in 1923, in America.

Fig.9. The American edition of Teleki's Carte Rouge (1923)
from the autor's private collection
Austria:
Randolf Rungaldier (1892-1981), who later became the president of the Geographical Society of Vienna had a very positive opinion about Teleki’s map:
Rungaldier, Randolf: Graf Teleki, Ethnographical map of Hungary, based on density of population. 1:1,000.000. Budapest 1922. Mitteilungen der Geographischen Gesellschaft.1923/4. 146.:
„Diese Karte sucht die bekannten Mängel der Darstellung von Sprachen und Nationen durch Flächenkolorit in der Weise zu vermeiden, dass sie die Bevölkerungsdichte zur Grundlage der Darstellung nimmt (1 km2 der Natur = 100 Einwohner). Dieses Verhältnis erlaubt die richtige, wenn auch etwas schematische Darstellung der Einwohnerzahl (nach Komitaten) auf dem flachen Lande, während es für die Darstellung der größeren Städte, besonders von Budapest zu klein ist. Durch kräftige Farben sind die Nationen unterschieden und die weiß gelassenen schwach- und unbesiedelten Räume treten deutlich hervor.
Der Zweck der Karte, große Übersichtlichkeit mit rechnerischer Genauigkeit zu vereinen, ist jedenfalls voll erreicht. Die Hauptsache einer derartigen Darstellungsart, die hier zum ersten Male versucht wird, ist das dem Maßstab entsprechende Verhältnis zwischen Flächen- und Bevölkerungseinheit. Es handelt sich hiebei nicht um einen der wahren Bevölkerungsdichte der einzelnen Landesteile möglichst nahekommenden Wert, sondern nur um die Darstellung der absoluten Menschenzahl durch eine gewisse Anzahl von kolorierten mm2. Dass dieser Wert mit der durchschnittlichen Dichte und mit dem Kartenmaßstab in Einklang stehen muss, ist selbstverständlich. Aber die wechselnde Dichte selbst kommt natürlich nicht zur Darstellung. Wie alle ungarische Karten, behandelt auch diese das Gebiet Altungarns, dessen unsinnige Zerstückelung dem waren Verlauf der Sprachgrenzen Hohn spricht.”
It thus becomes apparent, with the aid of these concrete examples, how differentially one can interpret the very same map according to momentary emotional/political/social factors.
According to the original map planned by Teleki and other cartographers, there were other maps they drew from. Of mention is Teleki's map which was made for the Mossul Commission. The works of this Commission were published in a book with many other maps in English and French. From the perspective of this analysis, the most important map is nr. 6., which was edited following Teleki’s method and principals. The image below shows that the map displays a very different picture in terms of population density, which in this case is much lower than expected.
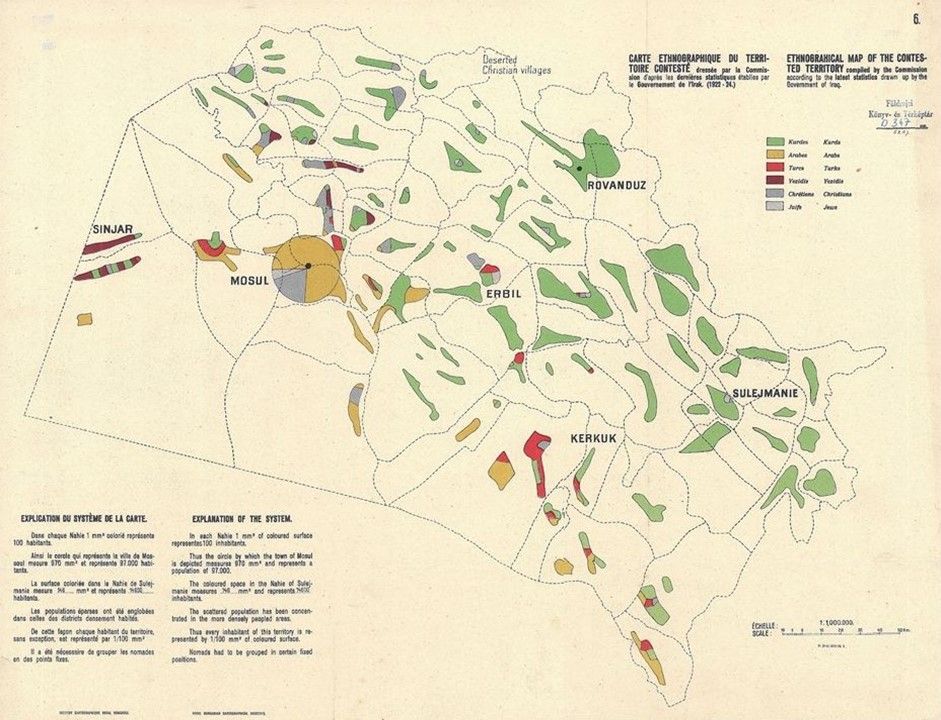
Fig.10. Teleki, Paul: Ethnographical map of the contested territory, 1925.
Source: MTA CSFK FTI Library D-3476 (Budapest)
In Autumn of 1919, Ferenc Fodor continued the map-making process based on Teleki’s method, but these maps were manuscript maps. According to a recollection from the 1950’s, these sheets were published by Teleki’s team under the name of the French professor G. Bery, in order to display this map as a French map. This map appeared to be a propaganda-map that utilized the surface coloring method. It was even easier to read from the perspective of the map-users as it did not contain the methodological explanation(s).
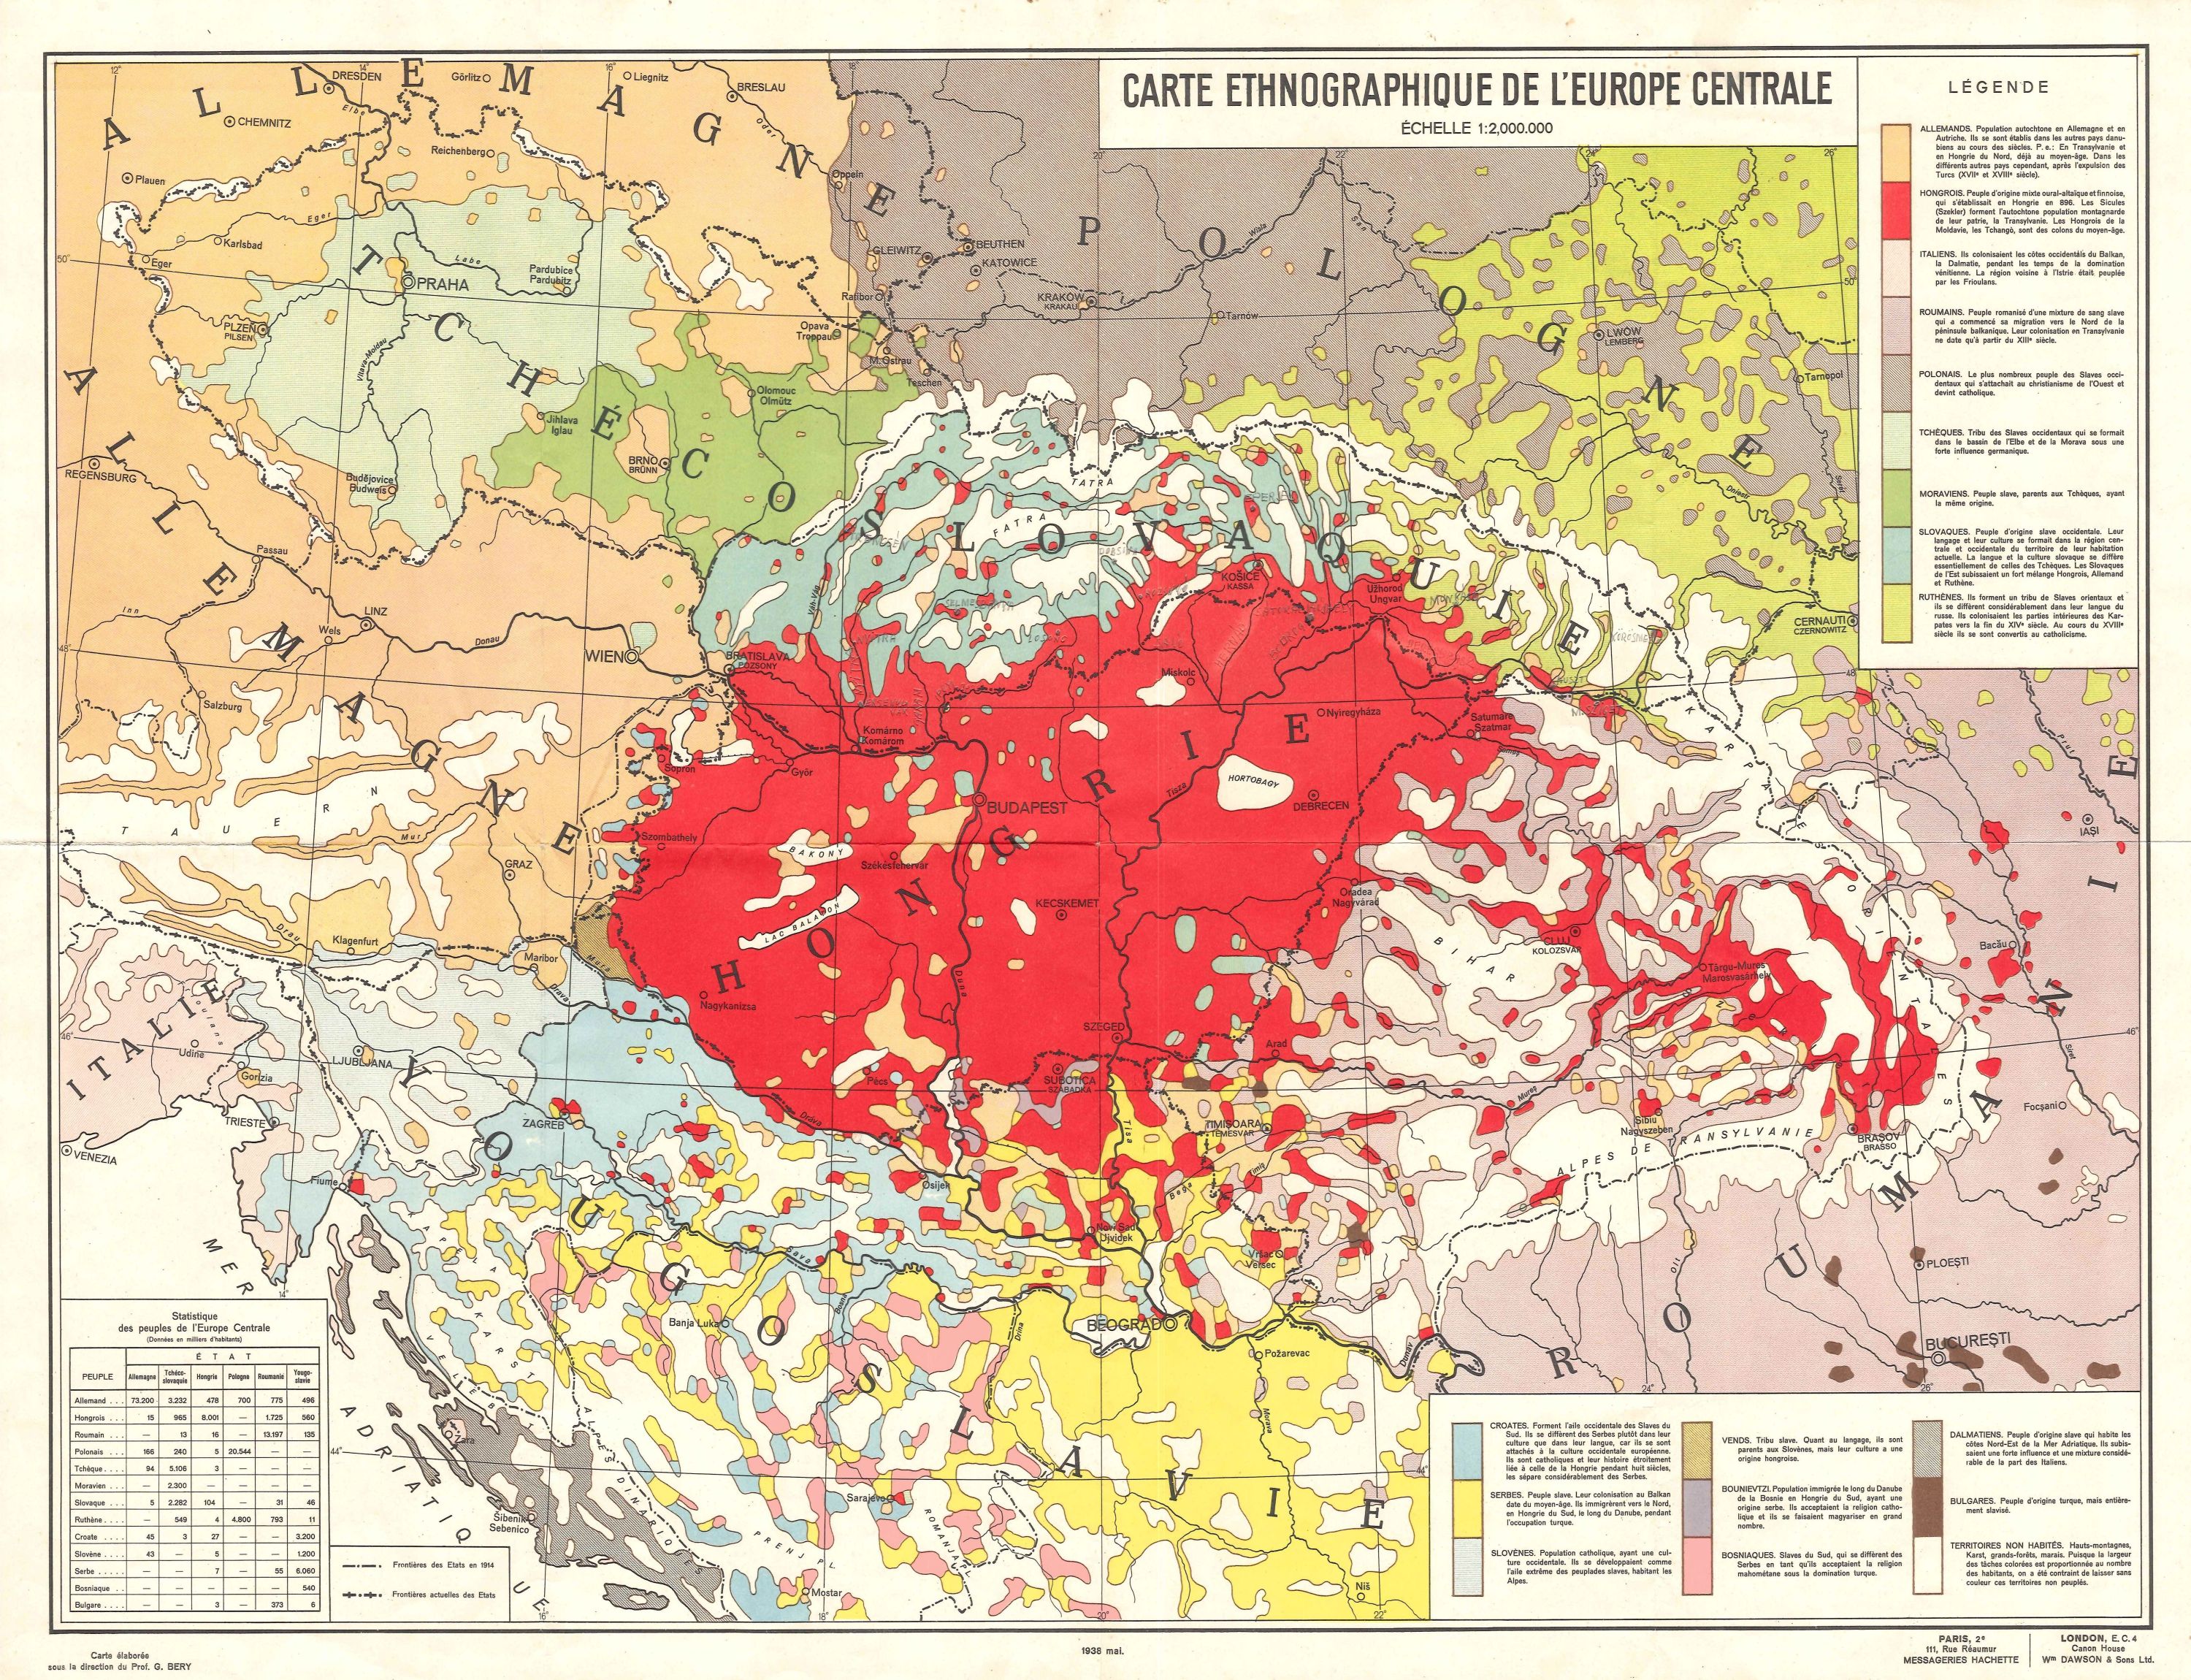
Fig.11. G. Bery: Carte ethnographique de L'Europe Centrale. 1938.
from the author's private collection
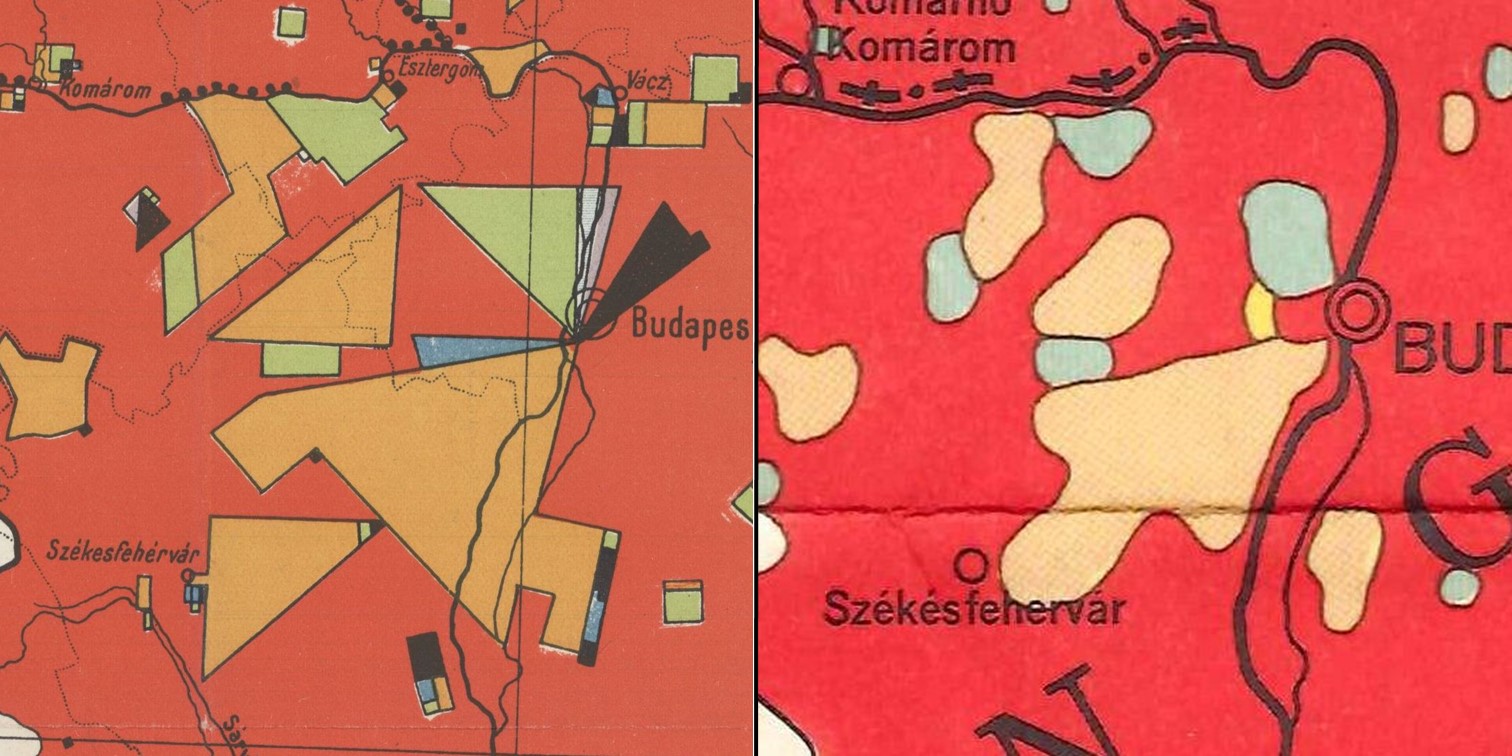
Fig.12. The Carte Rouge 1928 (left) and the Bery map (right)
from the author's private collection
In sum, as shown above, the Carte Rouge is one of the best-known and most appreciated Hungarian thematic maps both in Hungary and abroad. Moreover, in terms of Hungarian ethnic maps, it has the most editions. The map garnered a host of opinions that were varied in nature, with respect to the political influences of the times. Based on the parameters of this map, other maps were published based off of its earlier model. Furthermore, the representing method used in the Carte Rouge played an important role in the Mossul Commission.
Dániel Zoltán Segyevy
Many thanks to Zsofia Lovei, for her lingual revision of this text.
Literature:
Maps:
- Bátky, Zsigmond – Kogutowicz, Károly: Magyarország 1:200 000-es méretarányú néprajzi térképe. 1:200,000. Budapest: Magyar Földrajzi Társaság, 1918. 46 sheets, 57 × 38 cm
- Bery, G.: Carte ethnographique de L'Europe Centrale. 1:2,000,000. Paris/London, Messageries Hachette/Wm Dawson & Sons Ltd. 1938. 1 sheet, 57 × 42 cm
- Teleki, Pál: The ethnographical map of Hungary based on the density of population. 1:1,000,000. Budapest, Hungarian Geographical Institute, 1919. 1 szelvény, 80 × 58 cm
- Teleki, Paul: Ethnographical map of the contested territory. In: Questions of the Frontier between Turkey and Iraq. Report Submitted to the Council by the Commission Instituted by the Council Resolution of September 30. Genf: Leauge of Nations, 1925. 90. 1:1,000,000, 1 sheet, 50 × 39 cm
Books, articles:
- Cholnoky Jenő: Utazás az Amerikai Egyesült Államokban. Földrajzi Közlemények, 1912. 236.
- Joerg, Wolfgang Louis Gottfried: Recent geographical work in Europe. Geographical Review, 1922/3. 479.
- Joerg, Wolfgang Louis Gottfried (ed.): Memorial volume of the trancontinental excursion of 1912 of the American Geographical Society of New York. New York, 1915, American Geographical Society, 407.
- Klinghammer, István – Gercsák, Gábor: Der ungarische Geograph Pál Teleki als Mitglied der Mossul-Kommission. Cartographica Helvetica, 1999. 17–25.
- Segyevy, Dániel Zoltán: Carte Rouge 100.Teleki Pál vörös térképének hatástörténeti elemzése. Regio, 2018/4. 114-179.
- Teleki, Paul: The evolution of Hungary and its place in European history. New York: Macmillan, 1923.
Archival sources:
- UWM-American Geographical Society Library: Teleki's letter to Bowman on 25th December 1918 Correspondence between Isaiah Bowman and Count Paul Teleki. AGSL-Ny Archives, 189. box, 9. folder, 1. letter. (Milwaukee)
- UWM-American Geographical Society Library: Isaiah Bowman's letter to W. L. G. Joerg on 4th March 1919. Correspondence between Isaiah Bowman and W.L.G. Joerg. AGSNY AC 1, 185. box, 38. folder, 7. letter (Milwaukee)
-
The Carte Rouge manuscript from Bowman's personal collection. UWM-American Geographical Society Library, 642 C-1919a (Milwaukee)
Newspapers:
- Benda, Jenő: A „Carte Rouge” históriája. Beszélgetés Gróf Teleky Pállal a párisi ötöstanács elé került térképről. Pesti Hírlap, 22. January 1920 1.
- Magyarország új néprajzi térképe. 8 Órai Újság. 21. February 1919 5.
Online sources:
- Apponyi, Albert: https://www.britannica.com/biography/Albert-Grof-Apponyi
- Bowman, Isaiah: https://www.britannica.com/biography/Isaiah-Bowman
- Joerg, Wolfgang Louis Gottfried: https://www.jstor.org/stable/212101?seq=1#page_scan_tab_contents
- Joerg, Wolfgang Louis Gottfried (ed.): Memorial volume of the trancontinental excursion of 1912 of the American Geographical Society of New York. New York, 1915, American Geographical Society, 407. https://archive.org/details/memorialvolumeof00amerrich/page/n9
- Magyarország etnikai térképe. Anyanyelvek 1910 körül. https://mapire.eu/hu/map/magyarorszag_1910-etnikai/
- Nopcsa, Ferenc: http://www.elsie.de/pdf/articles/A1999VienneseNopcsa.pdf
- Rungaldier, Randolf: http://www.aeiou.at/aeiou.encyclop.r/r963667.htm;internal&action=_setlanguage.action?LANGUAGE=en
- Segyevy, Dániel Zoltán: A vörös térkép különböző változatai 1. Az 1919. évi kiadások. https://blog.oszk.hu/foldabrosz/voros-terkep-kulonbozo-valtozatai-1-az-1919-evi-kiadasok
- Segyevy, Dániel Zoltán: A vörös térkép különböző változatai 2. Az 1920. évi kiadások. https://blog.oszk.hu/foldabrosz/voros-terkep-kulonbozo-valtozatai-2-az-1920-evi-kiadasok
- Segyevy, Dániel Zoltán: A vörös térkép különböző változatai 3. https://blog.oszk.hu/foldabrosz/voros-terkep-kulonbozo-valtozatai-3-az-1922-es-1927-kozott-megjelent-kiadasok
- Segyevy, Dániel Zoltán: A vörös térkép különböző változatai 4. Az 1928 és 1941 között megjelent kiadások. https://blog.oszk.hu/foldabrosz/segyevy-daniel-zoltan-voros-terkep-kulonbozo-valtozatai-4-az-1928-es-1941-kozott
- Segyevy, Dániel Zoltán: Carte Rouge 100. A vörös térkép hatástörténeti elemzése. In: Regio. 2018/4. 114-179. https://regio.tk.mta.hu/index.php/regio/article/view/237/pdf_215
- Teleki, Pál: https://www.academia.edu/2640235/Pal_Teleki_1879-1941_The_Life_of_a_Controversial_Hungarian_Politician
- Vagács András: Fodor Ferenc: A magyar térképírás 3. kötet. Földrajzi Értesítő, 1956. 109-114. https://adtplus.arcanum.hu/hu/view/FoldrajziErtesito_1956/?pg=123&layout=s
- Zeidler, Miklós: Apponyi Albert párizsi beszéde. Forrásközlés. http://www.rubicon.hu/magyar/oldalak/apponyi_albert_parizsi_beszede_forraskozles/
An extended version of the post serie about the various versions and editions of the Carte Rouge will be available as article here: Segyevy, Dániel Zoltán: Vörös térkép 100. Teleki Pál néprajzi térképének különböző változatai 1919 és 1941 között. Térképtörténeti Közlemények. 3. [Maphistorical Journal 3.] 2019. 99-125.

